| 03/16/2011 11:41 am |

Moderator
Forum Addict

Regist.: 01/27/2011
Topics: 13
Posts: 75
 OFFLINE | INDICATORS OF TECHNICAL ANALYSIS
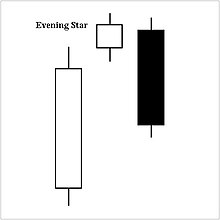
CANDLESTICK CHART:
A candlestick chart is a style of bar-chart used primarily to describe price movements of a security. It is most often used in technical analysis of equity and price patterns.
1. It is a combination of a line-chart and a bar-chart,
2. Each bar represents the range of price movement over a given time interval.
ক্যান্ডেল স্টিক Chart হল, BAR Chart এর একটি Style; যা প্রধানত কোন শেয়ারের মূল্য কোনদিকে পরিবর্তিত হচ্ছে বা হতে পারে তা ব্যাখ্যা করতে ব্যবহৃত হয়। শেয়ার মার্কেটের Technical Analysis এ Candlestick Chart বহুল ব্যবহৃত একটি পরিমাপক।

Candlesticks are usually composed of the body (black or white), and an upper and a lower shadow.
1. The area between the open and the close is called the real body. For a lower closing Black or Red, for a higher closing White or Green.
2. Price excursions above and below the real body are called shadows. The shadow illustrates the highest and lowest traded prices of a security during the time interval.
Candlestick গুলো সাধারণত সাদা বা সবুজ/কাল বা লাল Body (মূল অংশ) এবং নিচের ও উপরের Shadow দ্বারা গঠিত।
১. শেয়ারের Opening Price এবং Closing price দ্বারা গঠিত মূল অংশটি হল Candlestick এর মূল Body। কোন শেয়ারের Opening Price এর তুলনায় Closing Price যদি নিম্নমুখী বা নিচে হয়, তবে Candlestick এর মূল Body কাল বা লাল হবে অর্থাৎ Sell Presure বুঝায়। সাদা বা সবুজ Bodyর ক্ষেত্রে ঠিক তার উল্টোটা হবে।
২. কোন শেয়ার নির্দিষ্ট সময়ে Candle Stick এর মূল Bodyর উপরে ও নীচে Highest Price ও Lowest Price দ্বারা গঠিত লাইন কে Shadow বলে।
Use of candlestick charts:
Candlestick charts are a visual aid for decision making in stock trading. For example, when the bar is white and high relative to other time periods, it means buyers are very bullish. The opposite is true for a black bar.
শেয়ার মার্কেটে Candle Stick Chart সাধারণত কোন Stock এর উঠানামা (Movement) নির্ণয়ের ক্ষেত্রে অথবা Buy বা Sell এর সিদ্ধান্ত গ্রহণের ক্ষেত্রে পরিমাপক হিসাবে ব্যবহৃত হয়। যেমন- যখন Candle Stick এর Bar সাদা বা Green দেখায় তখন Buying Pressure বুঝায়। কাল বা Red Bar এর ক্ষেত্রে ঠিক তার উল্টোটা প্রকাশ করবে।
|
|
|
| 03/16/2011 12:26 pm |

NEWBIE

Regist.: 03/16/2011
Topics: 0
Posts: 1
OFFLINE | HMM! Its good to see that you have started learning! Good job! carry on bro! |
|
|
| 03/16/2011 12:31 pm |
Moderator
Forum Addict
Regist.: 01/27/2011
Topics: 13
Posts: 75
OFFLINE |  Originally Posted by Forex Trader: Originally Posted by Forex Trader:
HMM! Its good to see that you have started learning! Good job! carry on bro!
There is no limit of learning, U can join with us. Thankx BRO..... |
|
|
| 03/16/2011 1:46 pm |

NEWBIE
Regist.: 03/08/2011
Topics: 1
Posts: 2
OFFLINE | i also learn a little from here !!!!!
thanks ura dhura bro !!!! |
|
|
| 03/16/2011 2:34 pm |
Moderator
Forum Addict
Regist.: 01/27/2011
Topics: 13
Posts: 75
OFFLINE | Originally Posted by Rakib Ul Hasan:
i also learn a little from here !!!!!
thanks ura dhura bro !!!!
U R most welcome. The more U read the more U learn.
|
|
|
| 03/16/2011 3:27 pm |

Senior Member

Regist.: 01/26/2011
Topics: 0
Posts: 29
OFFLINE | THNX BROTHER,,,WHEN R U GOING TO POST UR FOLLOW UP LESSON? |
|
|
| 03/16/2011 9:45 pm |

Senior Member
Regist.: 01/06/2011
Topics: 2
Posts: 30
OFFLINE | THanks UDM |
|
|
| 03/17/2011 4:31 am |
Moderator
Forum Addict
Regist.: 01/27/2011
Topics: 13
Posts: 75
OFFLINE | Originally Posted by Rezaul Karim Sheikh:
THanks UDM
U R always welcome. |
|
|
| 03/17/2011 8:37 am |

NEWBIE
Regist.: 01/13/2011
Topics: 0
Posts: 1
OFFLINE | I want to learn from A B C |
|
|

 DSE SMALL INVESTORS PLATFORM (DSIP)
> DISCUSSION > NEWS AND INFO
DSE SMALL INVESTORS PLATFORM (DSIP)
> DISCUSSION > NEWS AND INFO INDICATORS OF TECHNICAL ANALYSIS :CANDLESTICK CHART:
 OFFLINE